 Charting library

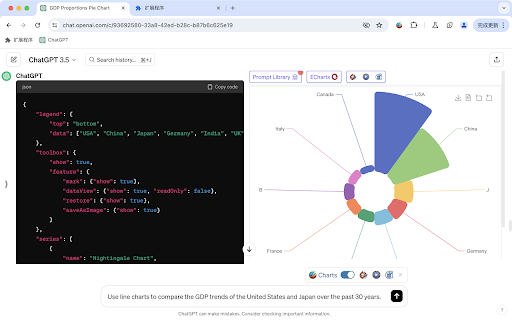
ECharts is a powerful, free charting and visualization library that offers a wide array of chart types, including line, bar, pie, scatter, map, and more. It's designed to be highly customizable and interactive, making it suitable for creating dynamic and engaging data visualizations for web applications, dashboards, and reports. ECharts supports both declarative configuration and imperative programming, allowing developers to tailor the charts to their specific needs. It also provides features like data zooming, tooltips, and visual encoding to enhance data exploration and understanding.
08 Jun 2024
Readmore