-
 AI presentation
05 Mar 2024Readmore
AI presentation
05 Mar 2024Readmore -
 AI chart maker
 CalcGen AI is a platform designed to create interactive charts, graphs, calculators, and data visualizations effortlessly using AI. It allows users to generate custom visualizations from their data and prompts, including options to input variables, limits, categories, sorting options, and filters. Users can share or embed these visualizations on their websites. CalcGen AI supports various data inputs, enhancing data storytelling and insights for businesses and educators.23 Oct 2024Readmore
 -
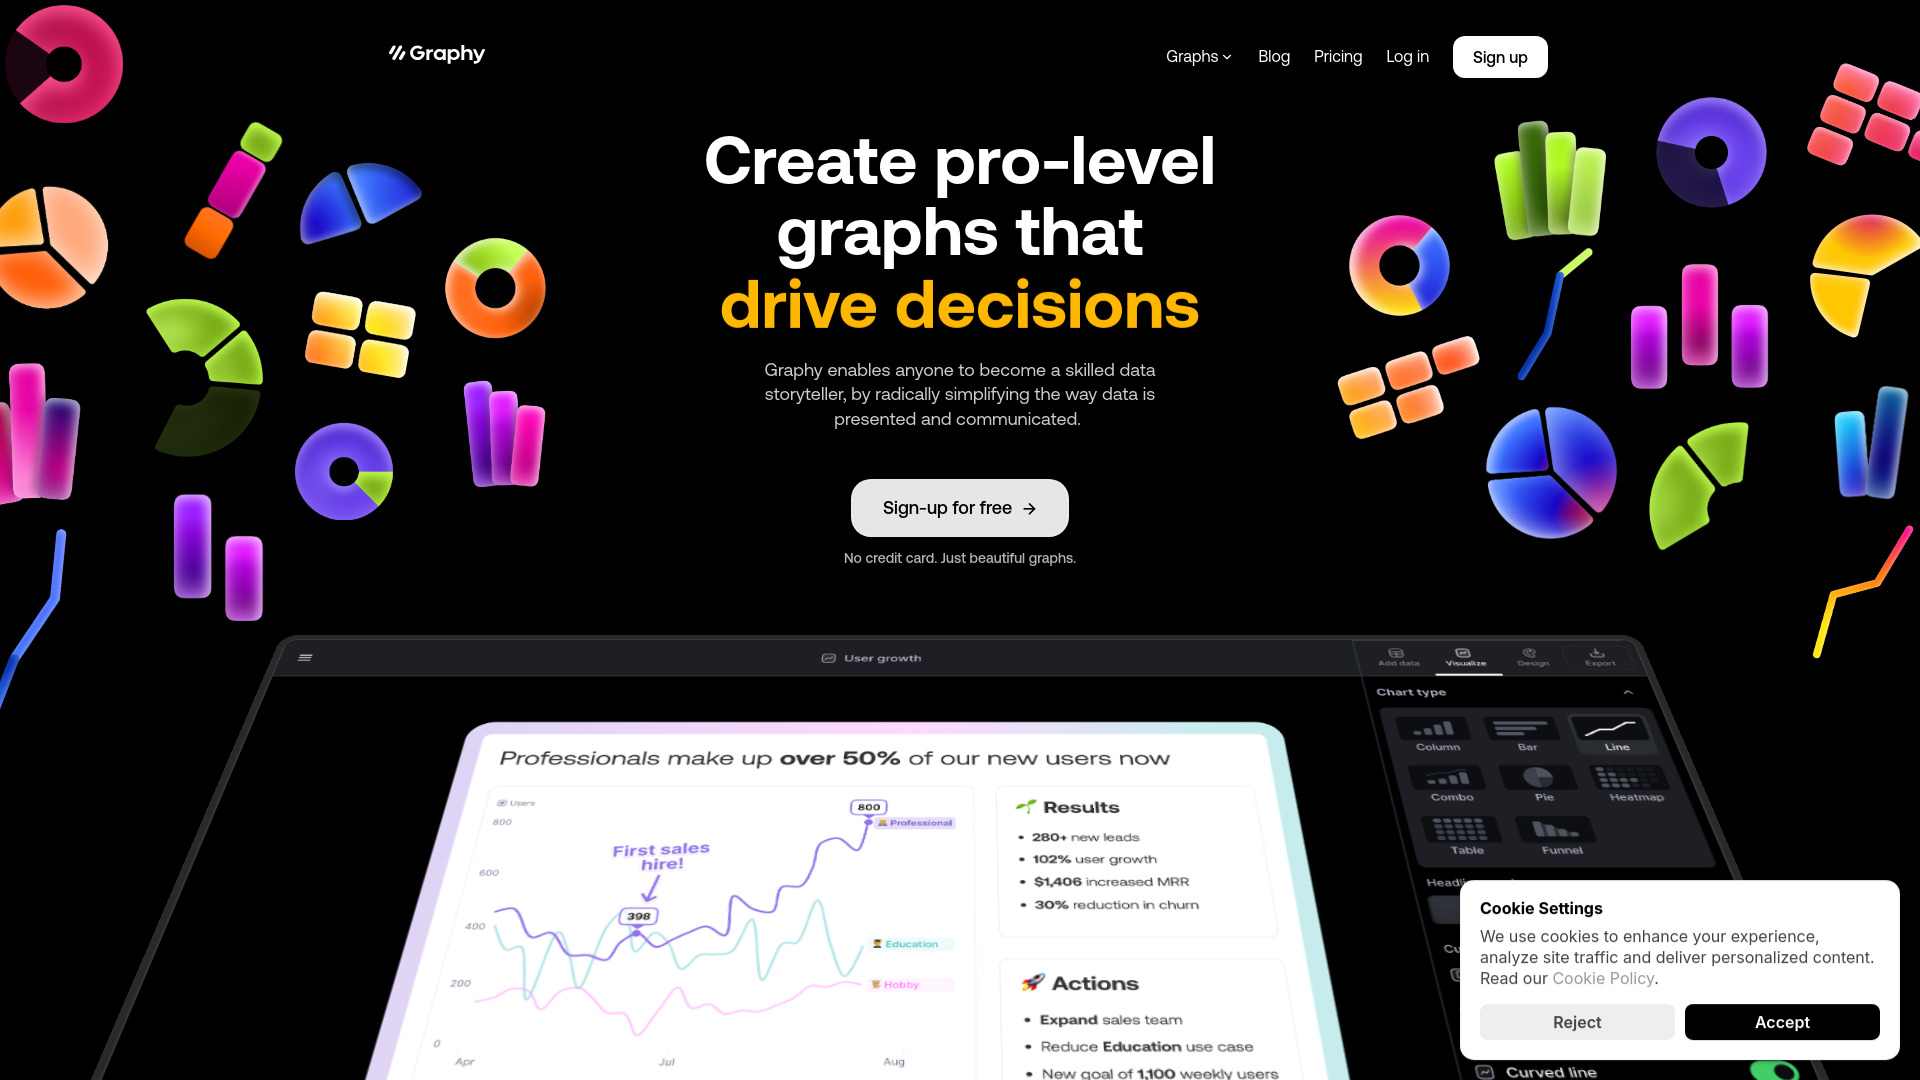 Data visualization
Graphy enables anyone to become a skilled data storyteller by radically simplifying the way data is presented and communicated. It allows users to create pro-level graphs that inspire actions, drive decisions, impress audiences, keep everyone aligned, and convince stakeholders. Trusted by 100,000+ users, Graphy offers AI-generated insights and graphs, connecting to Google Sheets and other data sources. It's built for modern teams, offering lightning-fast data visualization and easy-to-use interfaces.04 Mar 2025Readmore
Data visualization
Graphy enables anyone to become a skilled data storyteller by radically simplifying the way data is presented and communicated. It allows users to create pro-level graphs that inspire actions, drive decisions, impress audiences, keep everyone aligned, and convince stakeholders. Trusted by 100,000+ users, Graphy offers AI-generated insights and graphs, connecting to Google Sheets and other data sources. It's built for modern teams, offering lightning-fast data visualization and easy-to-use interfaces.04 Mar 2025Readmore -
 AI data analysis
ChartPixel is an AI-assisted data analysis and insights visualization platform that simplifies complex data analysis, making it accessible within seconds and with zero learning curve. It provides powerful AI-driven data analysis, interactive charts & graphs, and actionable insights from various data sources like messy data or questionnaires. ChartPixel's AI capabilities are rooted in robust statistics, helping users create appropriate charts and visualizations with explained insights and key takeaways. Users can also chat with their data and charts to uncover key information through AI-driven analysis. The platform aims to demystify data and analysis, empowering users to make sense of their data without hassle, suitable for both beginners and seasoned analytics professionals.17 Feb 2025Readmore
AI data analysis
ChartPixel is an AI-assisted data analysis and insights visualization platform that simplifies complex data analysis, making it accessible within seconds and with zero learning curve. It provides powerful AI-driven data analysis, interactive charts & graphs, and actionable insights from various data sources like messy data or questionnaires. ChartPixel's AI capabilities are rooted in robust statistics, helping users create appropriate charts and visualizations with explained insights and key takeaways. Users can also chat with their data and charts to uncover key information through AI-driven analysis. The platform aims to demystify data and analysis, empowering users to make sense of their data without hassle, suitable for both beginners and seasoned analytics professionals.17 Feb 2025Readmore -
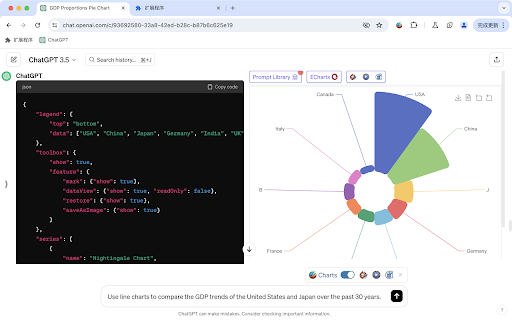 Charting library
ECharts is a powerful, free charting and visualization library that offers a wide array of chart types, including line, bar, pie, scatter, map, and more. It's designed to be highly customizable and interactive, making it suitable for creating dynamic and engaging data visualizations for web applications, dashboards, and reports. ECharts supports both declarative configuration and imperative programming, allowing developers to tailor the charts to their specific needs. It also provides features like data zooming, tooltips, and visual encoding to enhance data exploration and understanding.08 Jun 2024Readmore
Charting library
ECharts is a powerful, free charting and visualization library that offers a wide array of chart types, including line, bar, pie, scatter, map, and more. It's designed to be highly customizable and interactive, making it suitable for creating dynamic and engaging data visualizations for web applications, dashboards, and reports. ECharts supports both declarative configuration and imperative programming, allowing developers to tailor the charts to their specific needs. It also provides features like data zooming, tooltips, and visual encoding to enhance data exploration and understanding.08 Jun 2024Readmore