-
LLM visualization
Forking Path transforms complex AI conversations into clear, interactive timelines. It allows users to navigate, branch, and merge dialogue paths with unprecedented clarity. It offers universal support for all LLM platforms and provides powerful features for visualizing, managing, and understanding AI conversations at scale.02 Jan 2025Readmore -
AI graph maker
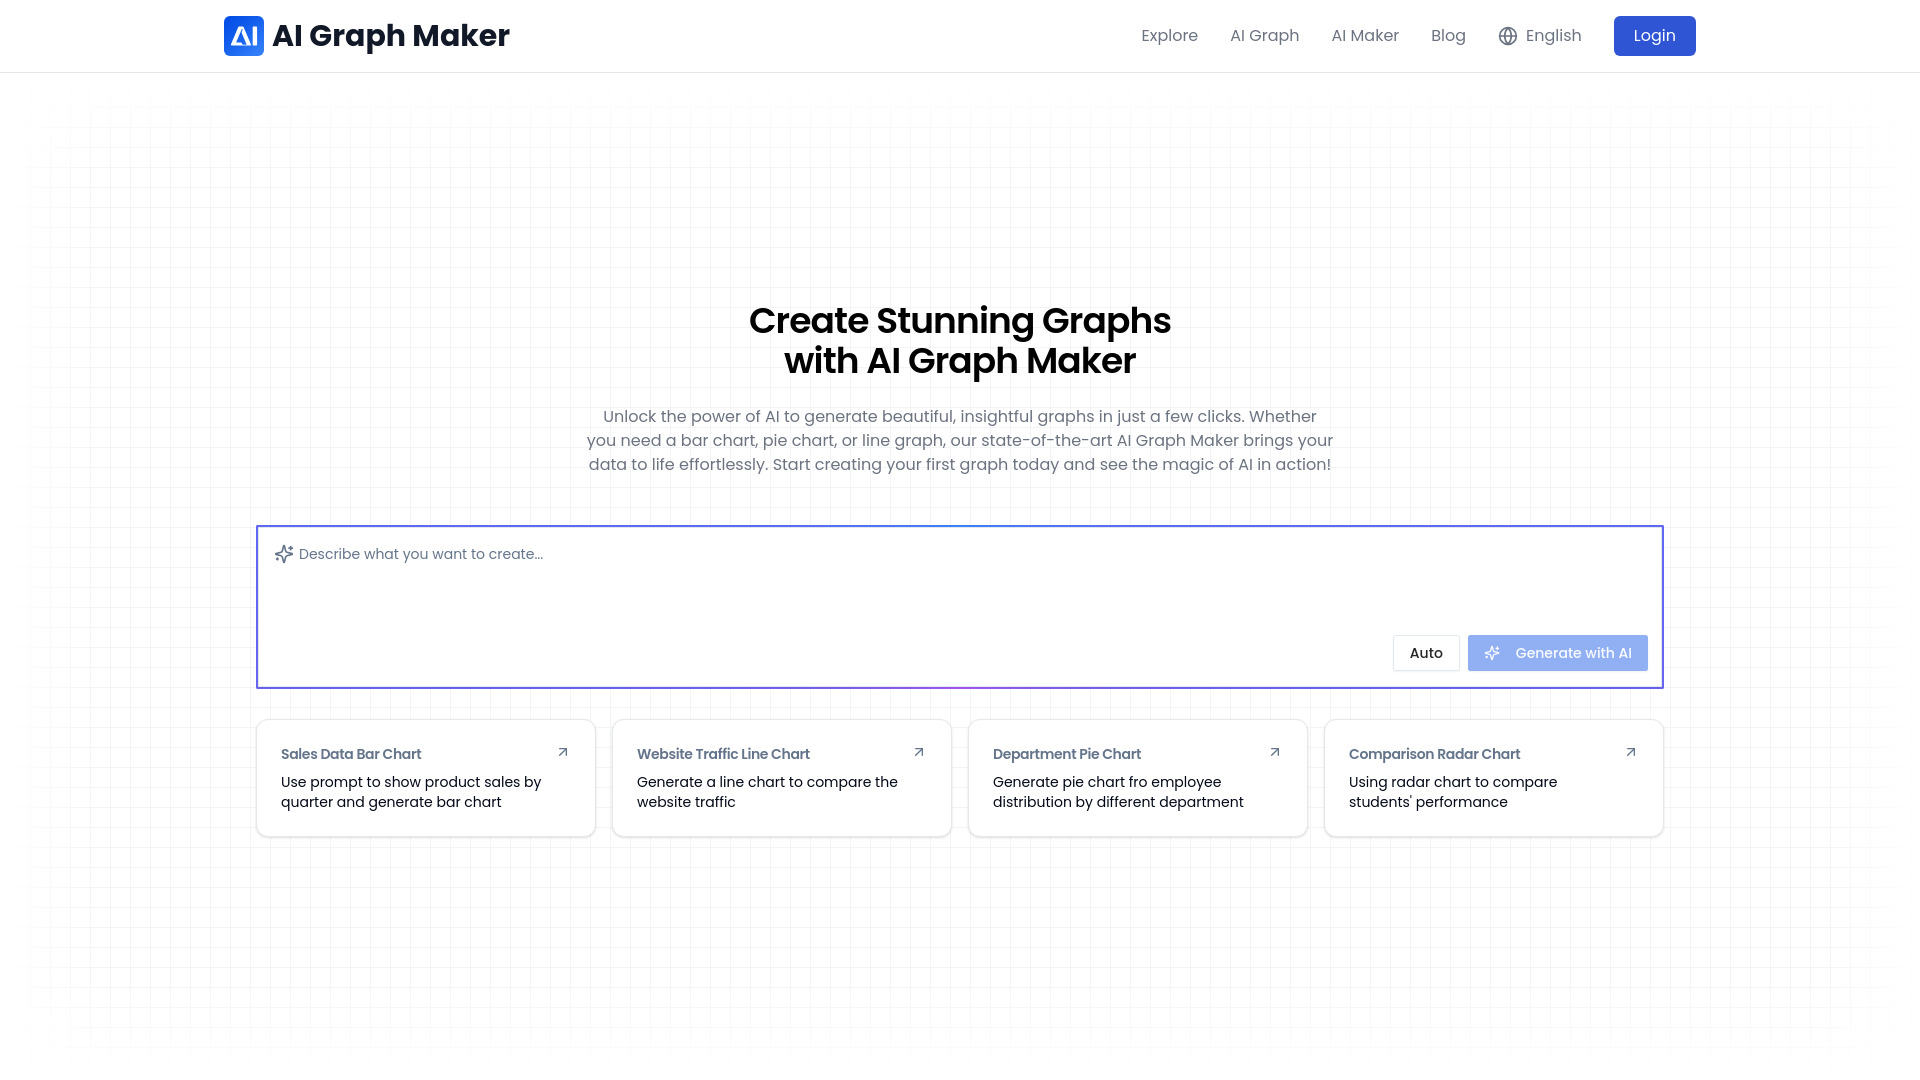
AI Graph Maker is an AI-powered tool that transforms data into stunning visualizations effortlessly. It allows users to create charts, graphs, and diagrams in minutes. The tool supports various chart types, including bar charts, line charts, flowcharts, pie charts, scatter plots, and more. It is designed for both professionals and beginners, offering a user-friendly interface and flexible editing and export options.13 Jan 2025Readmore -
AI math solver
MathGPT is an AI math solver and homework helper that creates Khan-Academy-style animated math videos to intuitively explain complex concepts to students. It helps students understand how to solve their problems step-by-step. MathGPT serves as an AI math calculator that solves algebra, calculus, chemistry, and physics problems, making it the ultimate homework helper and AI math solver.26 Nov 2024Readmore -
AI chart maker
CalcGen AI is a platform designed to create interactive charts, graphs, calculators, and data visualizations effortlessly using AI. It allows users to generate custom visualizations from their data and prompts, including options to input variables, limits, categories, sorting options, and filters. Users can share or embed these visualizations on their websites. CalcGen AI supports various data inputs, enhancing data storytelling and insights for businesses and educators.23 Oct 2024Readmore -
ChatGPT extension
This extension enhances your ChatGPT experience by providing a dynamic conversation tree graph inside a container that you can resize and move around the ChatGPT website. The graph visually represents the flow of your conversation, showing the sequence of messages and their branching paths. Informative tooltips display message content, version, and sibling count when you hover over nodes in the graph, making it more comprehensible to understand the branching history of the conversation. Additionally, you can zoom and drag the graph itself within the container, allowing for detailed exploration of the conversation structure. This feature is particularly valuable for getting oriented in even the most complexly branched conversations. This extension efficiently checks for new messages and updates the tree and highlights currently visible branch accordingly, without wasting resources when not in use.28 Aug 2024Readmore